Easy centralized logging on Kubernetes with Grafana Loki
Centralized Log Management is an essential solution for modern software development, especially when utilizing cloud native technologies. In Kubernetes, your application runs in pods which are relatively ephemeral i.e., disposable entities. Trailing the logs of pods is simply a nightmare and in general a very bad idea. A better approach is to persist all logs into a centralized data-source and search those logs through some sort of graphical user interface. This is exactly what Grafana Loki provides for your Kubernetes cluster.
In this post, I will show you how to setup your centralized logging solution on Kubernetes using Grafana and Loki. It will take less than 10 minutes.
What is Grafana Loki?
Loki is a horizontally-scalable, highly-available, multi-tenant log aggregation system.
When compared to other leading solutions such as the ELK (Elasticsearch, Logstash, Kibana) or EFK (Elasticsearch, Fluentd, Kibana) stacks, Loki characterizes itself by being more lightweight and cost effective. Loki stores logs in plain-text and tags them with labels (e.g. application name) rather than indexing the entire log content. This trade-off makes it cheaper to operate than a full index and allows developers to aggressively logs from their applications. The obvious drawback is that when a search filters on content rather than labels the full log chunks are retrieved and then filtered on the search window.
Pre-requisites
In order to be able to follow this tutorial you need a working Kubernetes cluster and Helm installed on your machine.
Add the Grafana Helm Repo
helm repo add grafana https://grafana.github.io/helm-charts
helm repo update
Install the Loki Stack
The Loki stack is a set of applications which will detect and ingest automatically your logs.
helm install loki-stack grafana/loki-stack \
--create-namespace \
--namespace loki-stack \
--set promtail.enabled=true,loki.persistence.enabled=true,loki.persistence.size=5Gi
The 5Gi represents the size of the persistence volume used by Loki. You need to make sure you define a size that it is sufficient for your use case.
Install Grafana
Grafana is the graphical user interface that we will use to connect to the Loki data-source and search our logs.
helm install loki-grafana grafana/grafana \
--namespace=loki-stack \
--set persistence.enabled=true,persistence.type=pvc,persistence.size=5Gi
The 5Gi represents the size of the persistence volume used by Grafana. You need to make sure you define a size that it is sufficient for your use case.
Quick Sanity Check
Let’s verify quickly if the deployments were successful by listing the pods on the loki-stack namespace.
kubectl get pods -n loki-stack
NAME                            READY   STATUS    RESTARTS   AGE
loki-grafana-65f64b5fc7-ktg4k   1/1     Running   0          2m
loki-stack-0                    1/1     Running   0          4m
loki-stack-promtail-kdfz4       1/1     Running   0          4m
Connecting to Grafana
Retrieve the Grafana Password
We will first retrieve the password for the admin user.
kubectl get secret --namespace loki-stack loki-grafana -o jsonpath="{.data.admin-password}" | base64 --decode ; echoCopy the output of the command above.
Forward a local port to Grafana
We will now open a connection between our host and the target Kubernetes cluster.
kubectl port-forward --namespace loki-stack service/loki-grafana 3000:80Access Grafana on your browser
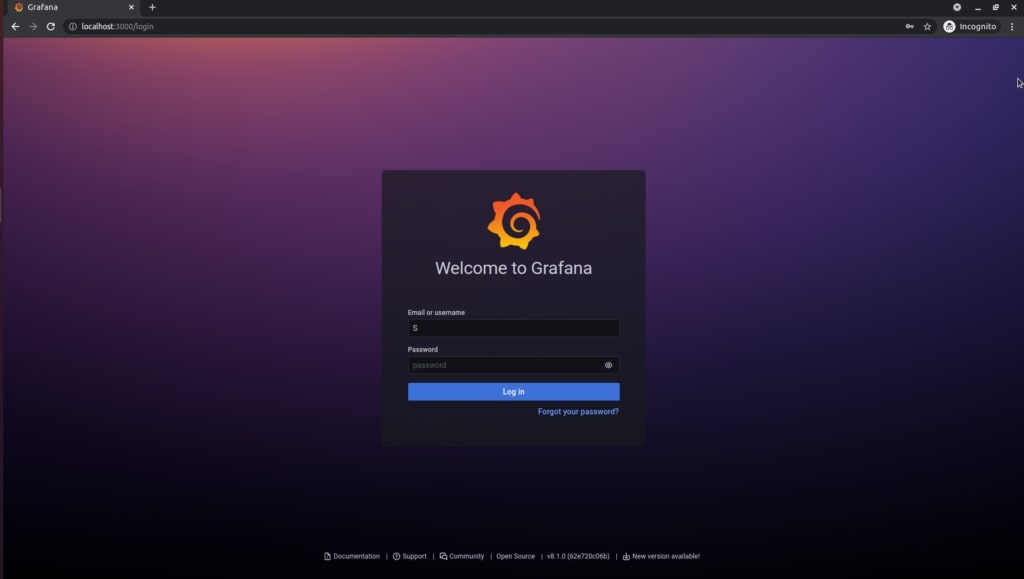
Open your web browser and go to http://localhost:3000. You will be greeted by the Grafana login page. Use admin as username and the password retrieved in the previous step.
Configure Grafana
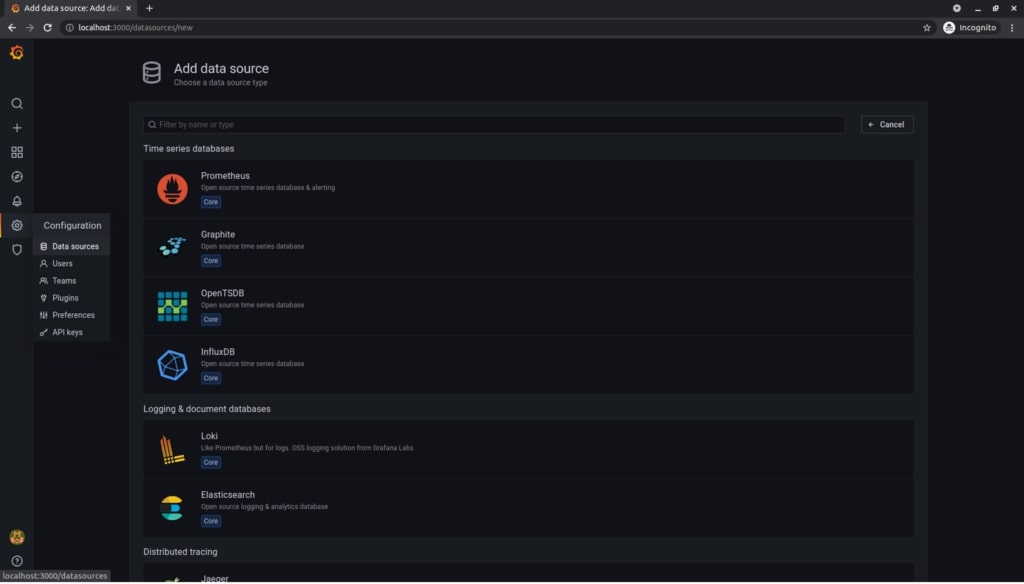
We will now add Loki as the data-source. Look for the Configuration cog on the left hand side menu as shown in the picture and then select Loki.
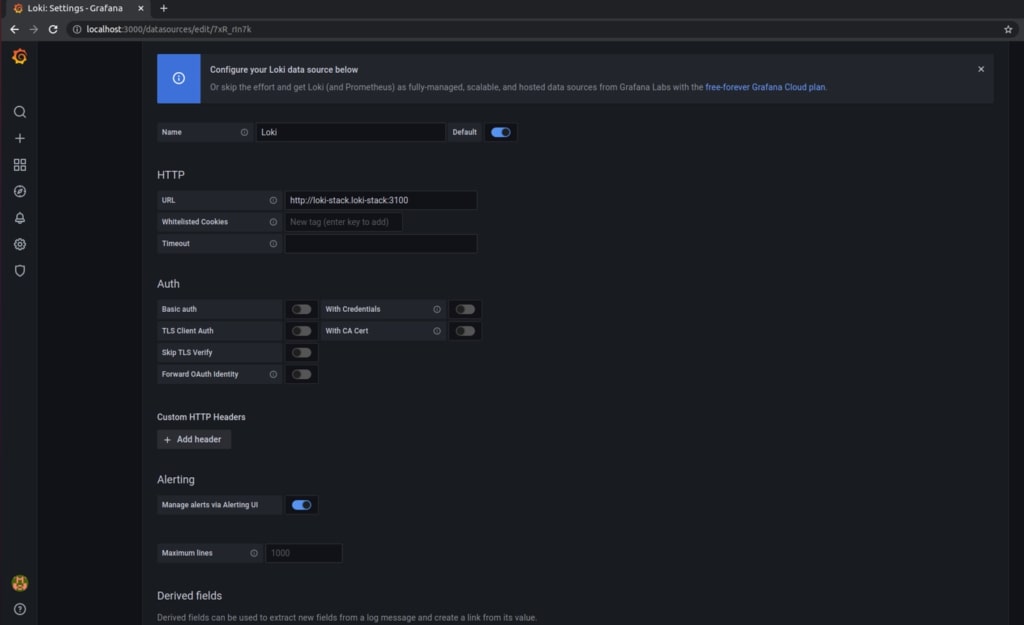
Now we configure the data-source by setting Loki as name and http://loki-stack.loki-stack:3100 as URL.
Done! Browse the logs now!
We did it! It’s time to get some insight on what is happening within our cluster.
Thanks to Promtail, a component of the Grafana Loki stack, logs are auto-detected and auto-labelled on our Kubernetes cluster. Let’s check for instance what is logging the Grafana server itself.
Let’s choose the Explore option on the menu.
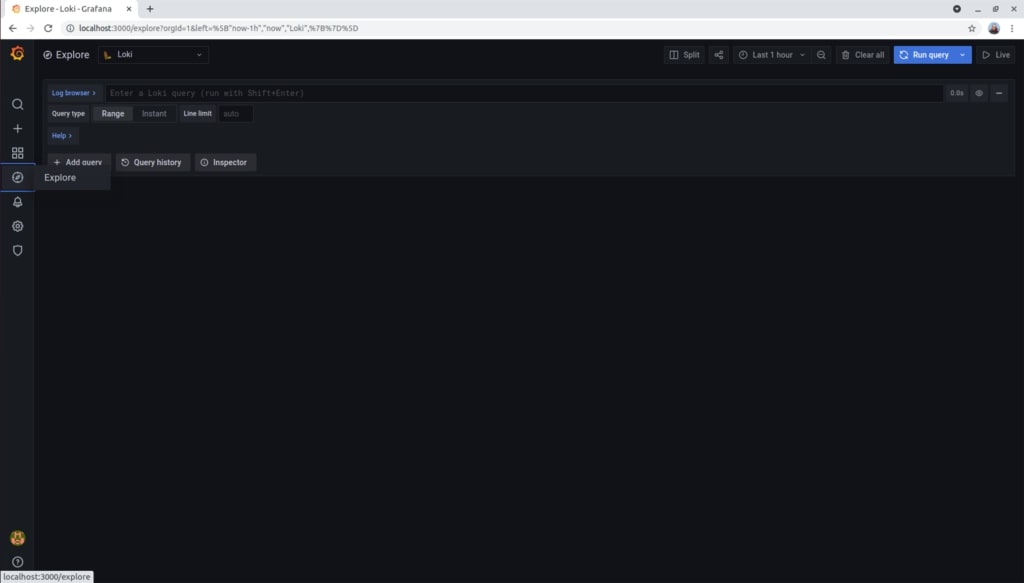
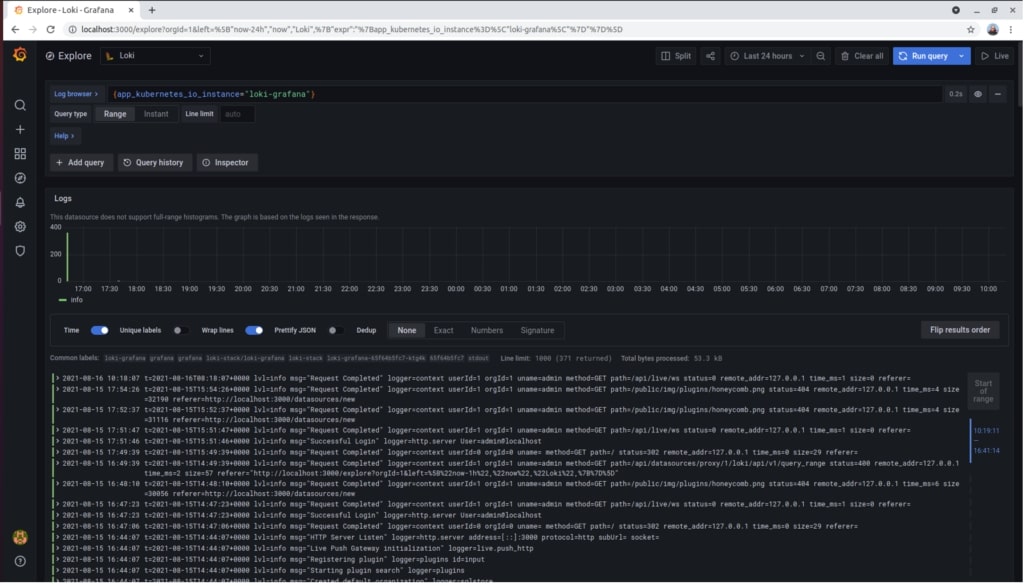
We now choose the app_kubernetes_io_instance label and loki-grafana as value and then we press Show logs.
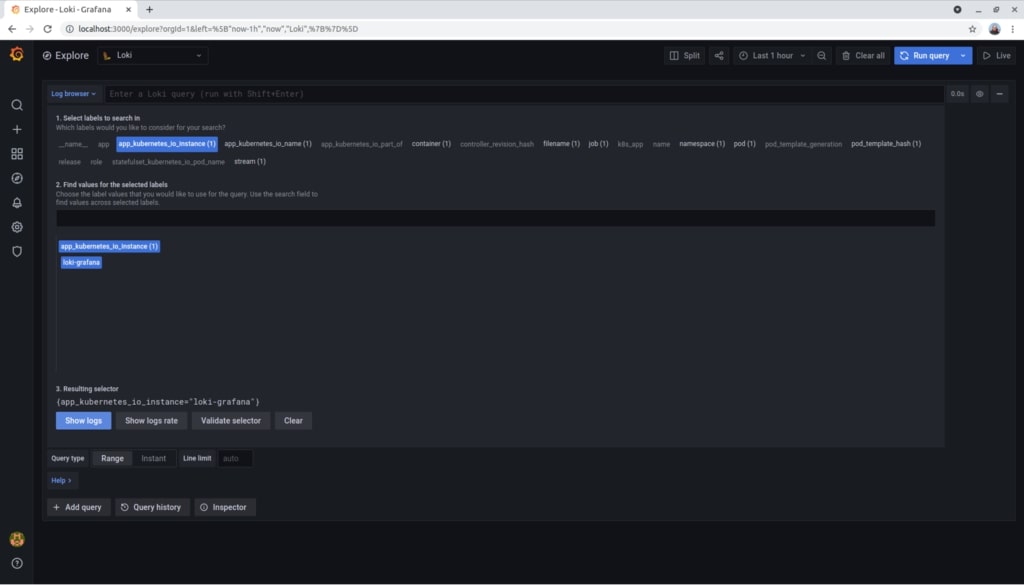
That’s all. We can now play with the time ranges and visualize our logs!
Conclusion
We now have a solid solution to centralize and visualize logs from our Kubernetes cluster.
You can explore further this approach by reading the Grafana Loki documentation in detail. I would focus on understanding its architecture and query language: LogQL.
Let me know if you enjoyed this article and you can also suggest a topic for the next by leaving a comment below.
Have a great day!
